





 +41 22 880 28 88
 +33 1 41 69 88 88 (Paris)
 +352 26 20 25 53 88
 +971 55 303 5161
 +66 92 372 4680

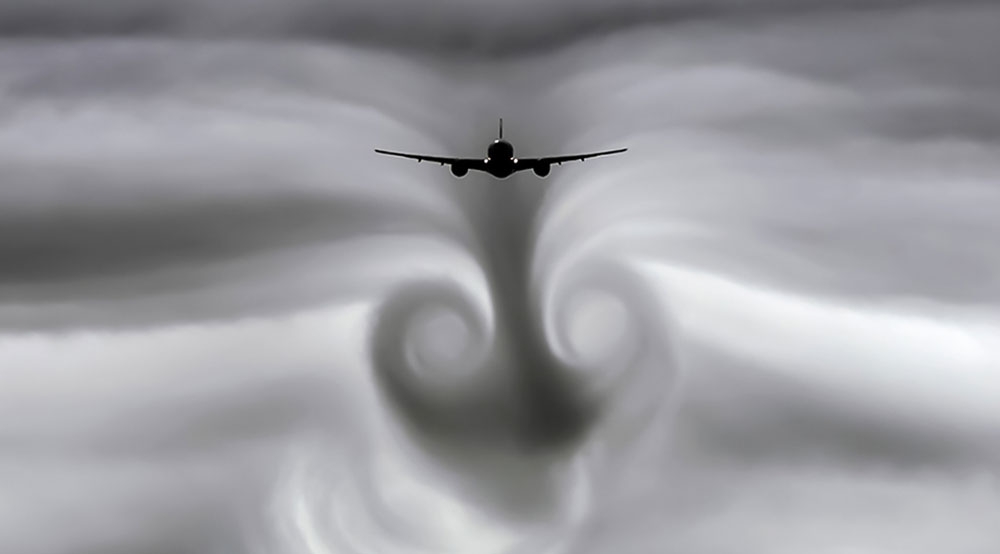
Atmospheric Turbulence: The Real Risk, Backed by Data
Turbulence is the leading cause of accidents in commercial air transport. But two figures overturn the picture most people have. First, it is not clear-air turbulence that injures people, it is thunderstorms, behind 57.7% of turbulence-related accidents. Second, across ten years of US commercial aviation, 26 passengers were seriously injured, and only one was wearing a seat belt. Here is what the reference report actually says, and what private flying genuinely changes.
What the numbers say, rather than the impressions
The reference is Preventing Turbulence-Related Injuries in Air Carrier Operations, published by the US NTSB on 10 August 2021. It covers ten years of operations, 2009 to 2018, on US commercial flights. The data is American and does not transfer mechanically to the rest of the world, but it is the only complete public data set on the subject.
Over that period, turbulence accounts for 37.6% of accidents in US commercial air transport, more than a third, making it the leading cause. The word "accident" carries a precise regulatory meaning here: a single serious injury is enough to qualify the event. Over ten years: 123 serious injuries, around twelve a year.
The breakdown is the most useful piece of information, and the least often quoted.
| Serious turbulence injuries, US commercial air transport, 2009-2018 | Number | Share |
| Cabin crew | 97 | 78.9% |
| Passengers | 26 | 21.1% |
| Flight crew (pilots) | 0 | 0% |
Nearly four out of five serious injuries are cabin crew, in other words the only people standing when the event happens. No pilot was seriously injured across the whole period: they are strapped in.
As for the aircraft itself, 95.5% of these accidents caused no damage at all. The remaining 4.5% were limited to minor cabin interior damage, seats, ceiling panels and bins. An honest qualification: structural break-ups in turbulence have occurred, but they date from the 1960s, before today's design, detection and forecasting standards. Across the last documented decade, no turbulence-related accident involved significant structural damage.
Seat belts: one seriously injured passenger in 26 was wearing one
This is the most actionable fact in the whole report, and it fits in one line. Of the 26 passengers seriously injured over ten years, only one was wearing a seat belt; seventeen were not. Among cabin crew, 81 of the 97 injured, or 83.5%, were not restrained, which is the nature of their job.
The NTSB draws an unambiguous conclusion: wearing a seat belt reduces the risk of serious injury for all occupants. In business aviation, where the cabin is more open and people move around more, the guidance applies identically. Belt fastened in cruise, even without the sign lit: it is the measure that halves the risk, and it costs nothing.
Five sources of turbulence, and it is not the one you expect
The NTSB distinguishes five origins: convection, clear-air shear, mountain waves, surface effects, meaning low-level mechanical turbulence, and wake vortices.
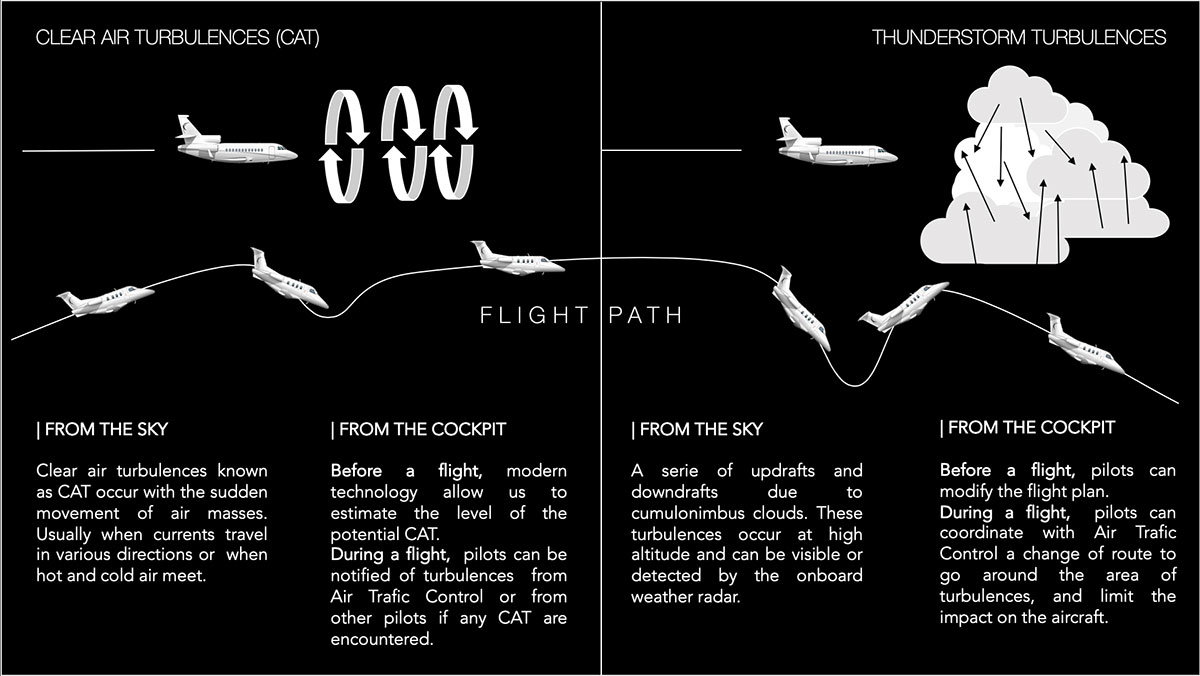
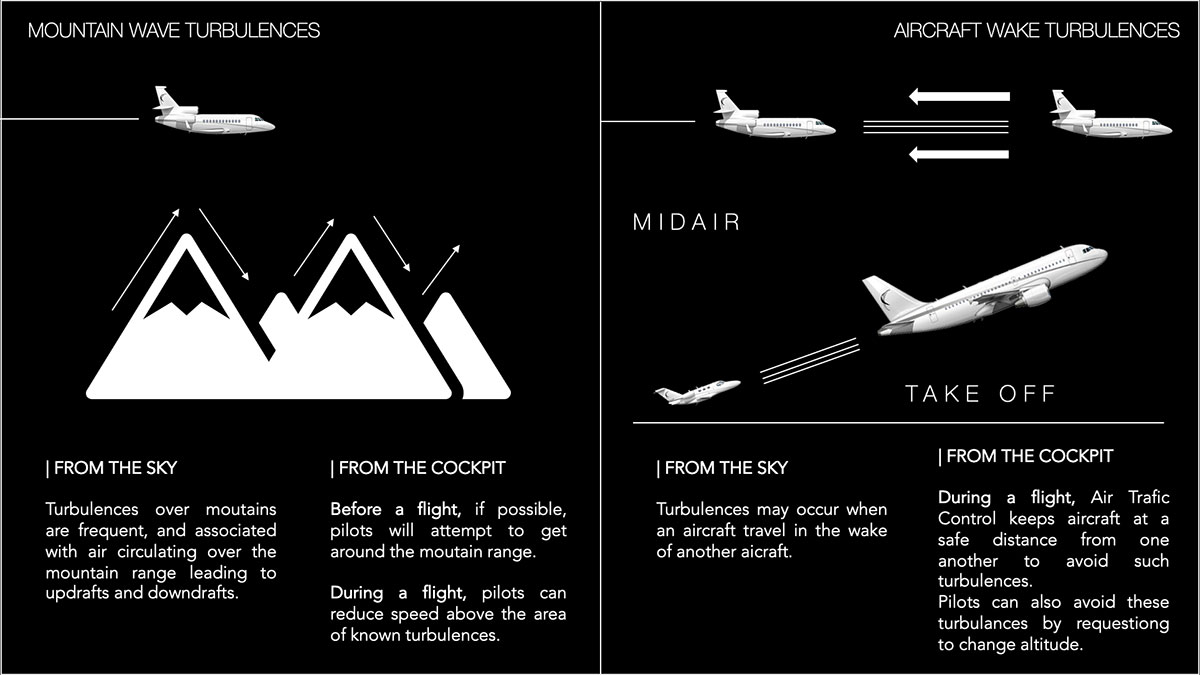
The real hierarchy of causes, however, contradicts what you read everywhere. Across the recorded accidents:
- Convective turbulence: 57.7%. Linked to thunderstorms, strong radar reflectivity and cumulonimbus, including when overflying them.
- Clear-air turbulence: 28.8%. Associated with jet streams, the immediate vicinity of the tropopause or upper-level fronts, normally above 15,000 ft.
- Mountain waves: 7.2%. Directly tied to terrain, where wind and thermal patterns produce breaking waves.
- Wake turbulence: 2.7%. The wingtip vortices of a preceding aircraft.
In other words: clear-air turbulence, which almost every article opens on because it is the most marketable climate angle, comes second, at half the share of thunderstorms. The most recent illustration is Singapore Airlines flight SQ321 on 21 May 2024, which caused one death at 37,000 ft: the Singaporean final report concludes it was not clear-air turbulence but a rapidly developing cumulonimbus.
A second received idea to correct: turbulence is not a high-altitude phenomenon. Around half of accidents occur in descent or approach, and 65.3% of those in descent happened below 20,000 ft.
Onboard weather radar does not detect turbulence
This is a widespread confusion, including among frequent flyers. Onboard weather radar detects precipitation droplets, not air movement. The FAA states it plainly in its advisory circular on thunderstorms: radar echoes indicate precipitation, not turbulence.
Two direct consequences. First, onboard radar cannot see clear-air turbulence, which by definition has no precipitation. Second, it does not even see all thunderstorm turbulence: hazardous turbulence can extend up to 20 miles beyond the edge of the echo, which is why cutting a storm close remains a bad idea. On SQ321, the onboard radar gave no alert at all.
Clear-air turbulence is increasing, but read the figure carefully
The "+55%" figure circulates everywhere, almost always misstated. The study is by Mark Prosser, Paul Williams, Simon Marlton and Giles Harrison, published in Geophysical Research Letters in June 2023. What it actually measures: at a typical point over the North Atlantic, the cumulative annual duration of severe turbulence rose from 17.7 hours in 1979 to 27.4 hours in 2020.
So it is not "55% more flights affected", nor "55% more turbulence" in any general sense. And to stay honest, the three figures belong together, not just the most striking one: severe turbulence +55%, moderate +37%, light +17%. A useful order of magnitude: 27.4 hours a year represents about 0.3% of the year.
Projections of a doubling or tripling, often presented in the present tense, are climate model outputs. Williams and Joshi (2013) model, under a doubled CO2 concentration scenario, an increase of around 149% in the volume of airspace containing severe turbulence in winter over the transatlantic corridor. Storer, Williams and Joshi (2017) project, for the 2050 to 2080 period at 39,000 ft, a rise in severe turbulence of about 180% over the North Atlantic and 160% over Europe. These are projections, not observations, and they start from a low base.
Flying higher does not mean flying above the turbulence
This is the industry's most repeated claim, and it does not survive the numbers. It is true that some long-range business jets have a certified ceiling of 51,000 ft, such as the Falcon 8X, the Global 7500 and the Gulfstream G650ER. But three facts correct the picture.
- Ceiling is not cruise altitude. The G650ER begins its cruise at 41,000 ft; the Global 7500, at maximum takeoff weight, is limited to 43,000 ft in initial cruise. On a long, loaded sector, a heavy business jet therefore starts in the same band as an A350 or a B787.
- The 51,000 ft ceiling does not apply to the whole segment. The Citation Longitude, a super midsize very present in charter, tops out at 45,000 ft. Generalising would be wrong.
- That band is precisely where clear-air turbulence lives. CAT concentrates around the tropopause, at about 36,000 ft in standard atmosphere, and is encountered from 7,000 ft below to around 3,000 ft above. FL410 to FL450 sits right inside it.
What altitude genuinely allows is overflying convective systems, the ones causing 57.7% of accidents. With one limit: in the tropics, cumulonimbus tops sometimes exceed 50,000 ft. The benefit is real, it is simply narrower than it is made out to be.
What private flying really changes: flexibility
The real advantage is not altitude, it is room to manoeuvre. Clear-air turbulence is thin and patchy: according to SKYbrary, a level change of 2,000 ft is often enough to leave it. You still have to be able to ask for it and get it.
A private flight is not embedded in a connection bank. It can shift its departure time, reroute around a convective area without trading against a rotation plan, request a level change more freely, and divert to a secondary airfield. On a scheduled flight, each of those decisions is negotiated against slot, flow and connection constraints.
The quality of the operator matters too. The tools exist and are spreading, but they are not universal.
- EDR (eddy dissipation rate) is the official turbulence intensity metric recognised by ICAO. Computed onboard from sensor data, it is objective, unlike a pilot report, which stays subjective and aircraft-type dependent.
- PIREPs, the voice reports filed by crews, remain underused. An estimate cited by the NTSB indicates that in 2018, out of roughly 10 million transmissions carrying usable weather information, fewer than 900,000 PIREPs were actually filed, and almost never to report smooth air, which is nonetheless useful for bounding an area.
- IATA Turbulence Aware pools anonymised EDR data: 28 airlines, around 2,800 aircraft and 24.8 million reports in the first half of 2025 alone. IATA opens the platform to business aviation, but access requires an agreement and the segment's equipment rate is not public.
That is exactly what gets checked when selecting an operator, not in a brochure. As an independent broker, we select certified operators on safety and equipment criteria before building a flight.
IBC Aviation private jet charter:
Our teams advise you on the private jet best suited to your itinerary and your requirements, and arrange your flight to or from any destination, taking the conditions of the day into account. Available 24/7:
- France: +33 1 41 69 88 88
- Switzerland: +41 22 880 28 88
- Dubai: +971 55 303 5161
- Bangkok: +66 92 372 4680
- Email: contact@ibc-aviation.com
Frequently asked questions
Is turbulence dangerous on an aircraft?
It is the leading cause of accidents in US commercial air transport, at 37.6% of accidents between 2009 and 2018, but the individual risk stays low: 123 serious injuries in ten years, of which only 26 were passengers, around 2.6 a year. In 95.5% of cases the aircraft sustained no damage. Injuries mainly affect cabin crew, who are standing: they account for 78.9% of serious injuries.
Which type of turbulence is the most dangerous?
Convective turbulence, linked to thunderstorms, which accounts for 57.7% of turbulence-related accidents. Clear-air turbulence comes second at 28.8%, ahead of mountain waves (7.2%) and wake turbulence (2.7%). Contrary to a common belief, around half of accidents occur in descent or approach.
Does the aircraft radar detect turbulence?
No. Onboard weather radar detects precipitation droplets, not air movement. It therefore cannot see clear-air turbulence, which has no precipitation, and it does not see all thunderstorm turbulence either: that can extend up to 20 miles beyond the edge of the radar echo.
Is turbulence increasing with climate change?
Over the North Atlantic, the cumulative annual duration of severe turbulence at a typical point rose from 17.7 hours in 1979 to 27.4 hours in 2020, an increase of 55% (Prosser et al., Geophysical Research Letters, 2023). Moderate turbulence rose 37% and light turbulence 17%. Doubling or tripling scenarios for 2050 to 2080 are climate model projections, not observations.
Does a private jet fly above the turbulence?
Not in the way people imagine. Some long-range business jets have a 51,000 ft ceiling, but the Gulfstream G650ER begins its cruise at 41,000 ft and the Global 7500 at 43,000 ft at maximum weight, the same band as an A350 or a B787. Clear-air turbulence, meanwhile, concentrates around the tropopause at about 36,000 ft. Altitude mainly helps to overfly thunderstorms. The real advantage of private flying is flexibility: changing the time, the route or the flight level without trading against a rotation plan.